Ranges and Accuracy
| Indicator | Range | Resolution | Error |
|---|---|---|---|
| PM2.5/PM10 | 0–999 μg/m³ | 1 | ±10 μg/m³ |
| Formaldehyde (HCHO) | 0–3.00 mg/m³ | 0.01 | Less than ±0.02 mg/m³ |
| TVOC | 0–2.00 mg/m³ | 0.01 | ±0.1 mg/m³ |
| CO₂ | 350–5000 ppm | 1 | ±50 ppm |
| Temperature | -25 to 85 °C | — | ±1.0 °C |
| Humidity | 0–99 %RH | — | ±8 %RH |
Comparison tests
The channels above have been compared with the following professional instruments. These tests evaluate trend consistency and tracking error; they do not claim equivalent accuracy.
| Channel | Reference instrument | Test observation |
|---|---|---|
| PM2.5 | TSI DustTrak II 8530 | High trend consistency in the cigarette-smoke challenge test |
| CO₂ | FLUKE 975 professional gas analyzer | Tracking error remained controlled across the full range |
| Formaldehyde (HCHO) | InterScan 4610 | Direct pure-formaldehyde comparison; mixed-TVOC calibration in household scenarios removes cross-interference |
| TVOC | RAE3000 ppb-level VOC monitor | Trend comparison across the 0–2 mg/m³ range |
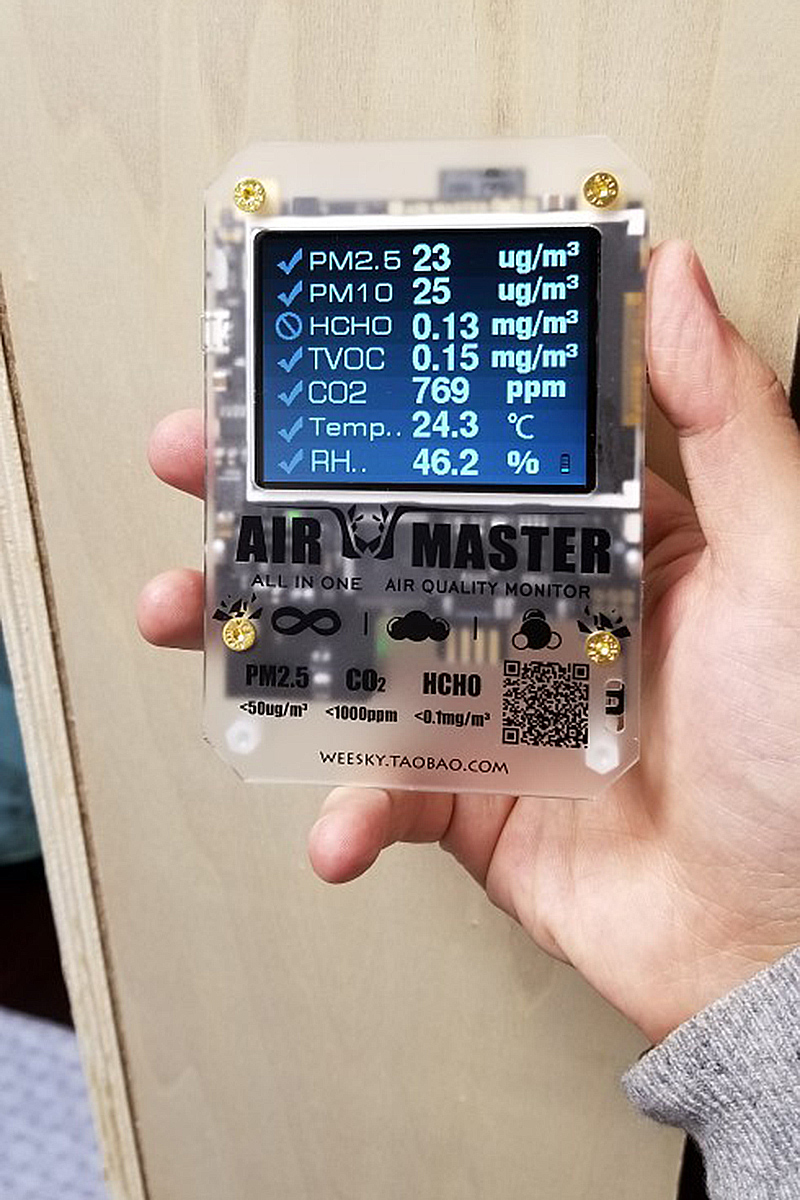
2.4-inch high-definition display
The device displays all seven indicators in real time. It supports Chinese and English, six-channel particle counting, a 32-minute concentration graph, and local recording to a TF card.
Indoor air quality reference standard GB/T 18883-2002
Readings are grouped according to the following reference levels (Excellent / Good / Moderate / Poor / Hazardous):
| Indicator | Excellent | Good | Moderate | Poor | Hazardous | Unit |
|---|---|---|---|---|---|---|
| PM2.5 | 10 | 30 | 50 | 100 | 300+ | μg/m³ |
| Formaldehyde | 0.01 | 0.05 | 0.08 | 0.10 | 0.3 | mg/m³ |
| TVOC | 0.20 | 0.40 | 0.60 | 1.5 | 3.0 | mg/m³ |
| CO₂ | 450 | 750 | 1000 | 1500 | 3000 | ppm |